Cancer incidence and mortality
What is cancer incidence?
This is the number of cases of cancer diagnosed in a population or group over a particular period of time. For example, this is the number of cases of cancer diagnosed in NSW in one year.
What is cancer mortality?
This is the number of deaths from cancer in a population or a large group over a particular period of time. For example, this is the number of people in NSW who die from cancer in one year.
What is regional variation?
Cancer incidence, mortality, and other measures can vary from one local health district (LHD) or hospital to another. There can be many reasons for this; however, it is useful to measure these differences and understand why they occur. This learning can highlight opportunities to improve outcomes for people living with cancer.
 Important
The findings in this report relate to populations, or large groups of people. They do not predict what will happen to an individual person who has cancer.
Overall key findings: Cancer incidence and mortality
- In 2020, 48,846 cases of cancer are expected to be diagnosed in NSW. This is an incidence rate of 483.7 new cancer diagnoses for every 100,000 people living in NSW.[1]
- By 2022, the total number of cancer cases is expected to increase as the NSW population grows. The incidence rate is likely to stay about the same.[1]
- In 2020, 15,756 people are expected to die from cancer in NSW. This is a mortality rate of 146.4 cancer deaths for every 100,000 people living in NSW.[1]
- By 2022, the total number of cancer deaths is expected to increase as the NSW population grows. The mortality rate is expected to fall to 142.1 for every 100,000 people.[1]
Cancer incidence and mortality rates significantly higher or lower than NSW, by local health district of residence 2012–2016
Key finding:
- Cancer incidence and mortality rates vary from one local health district to another. There can be many reasons for this, but it is useful to measure these differences and understand why they occur.

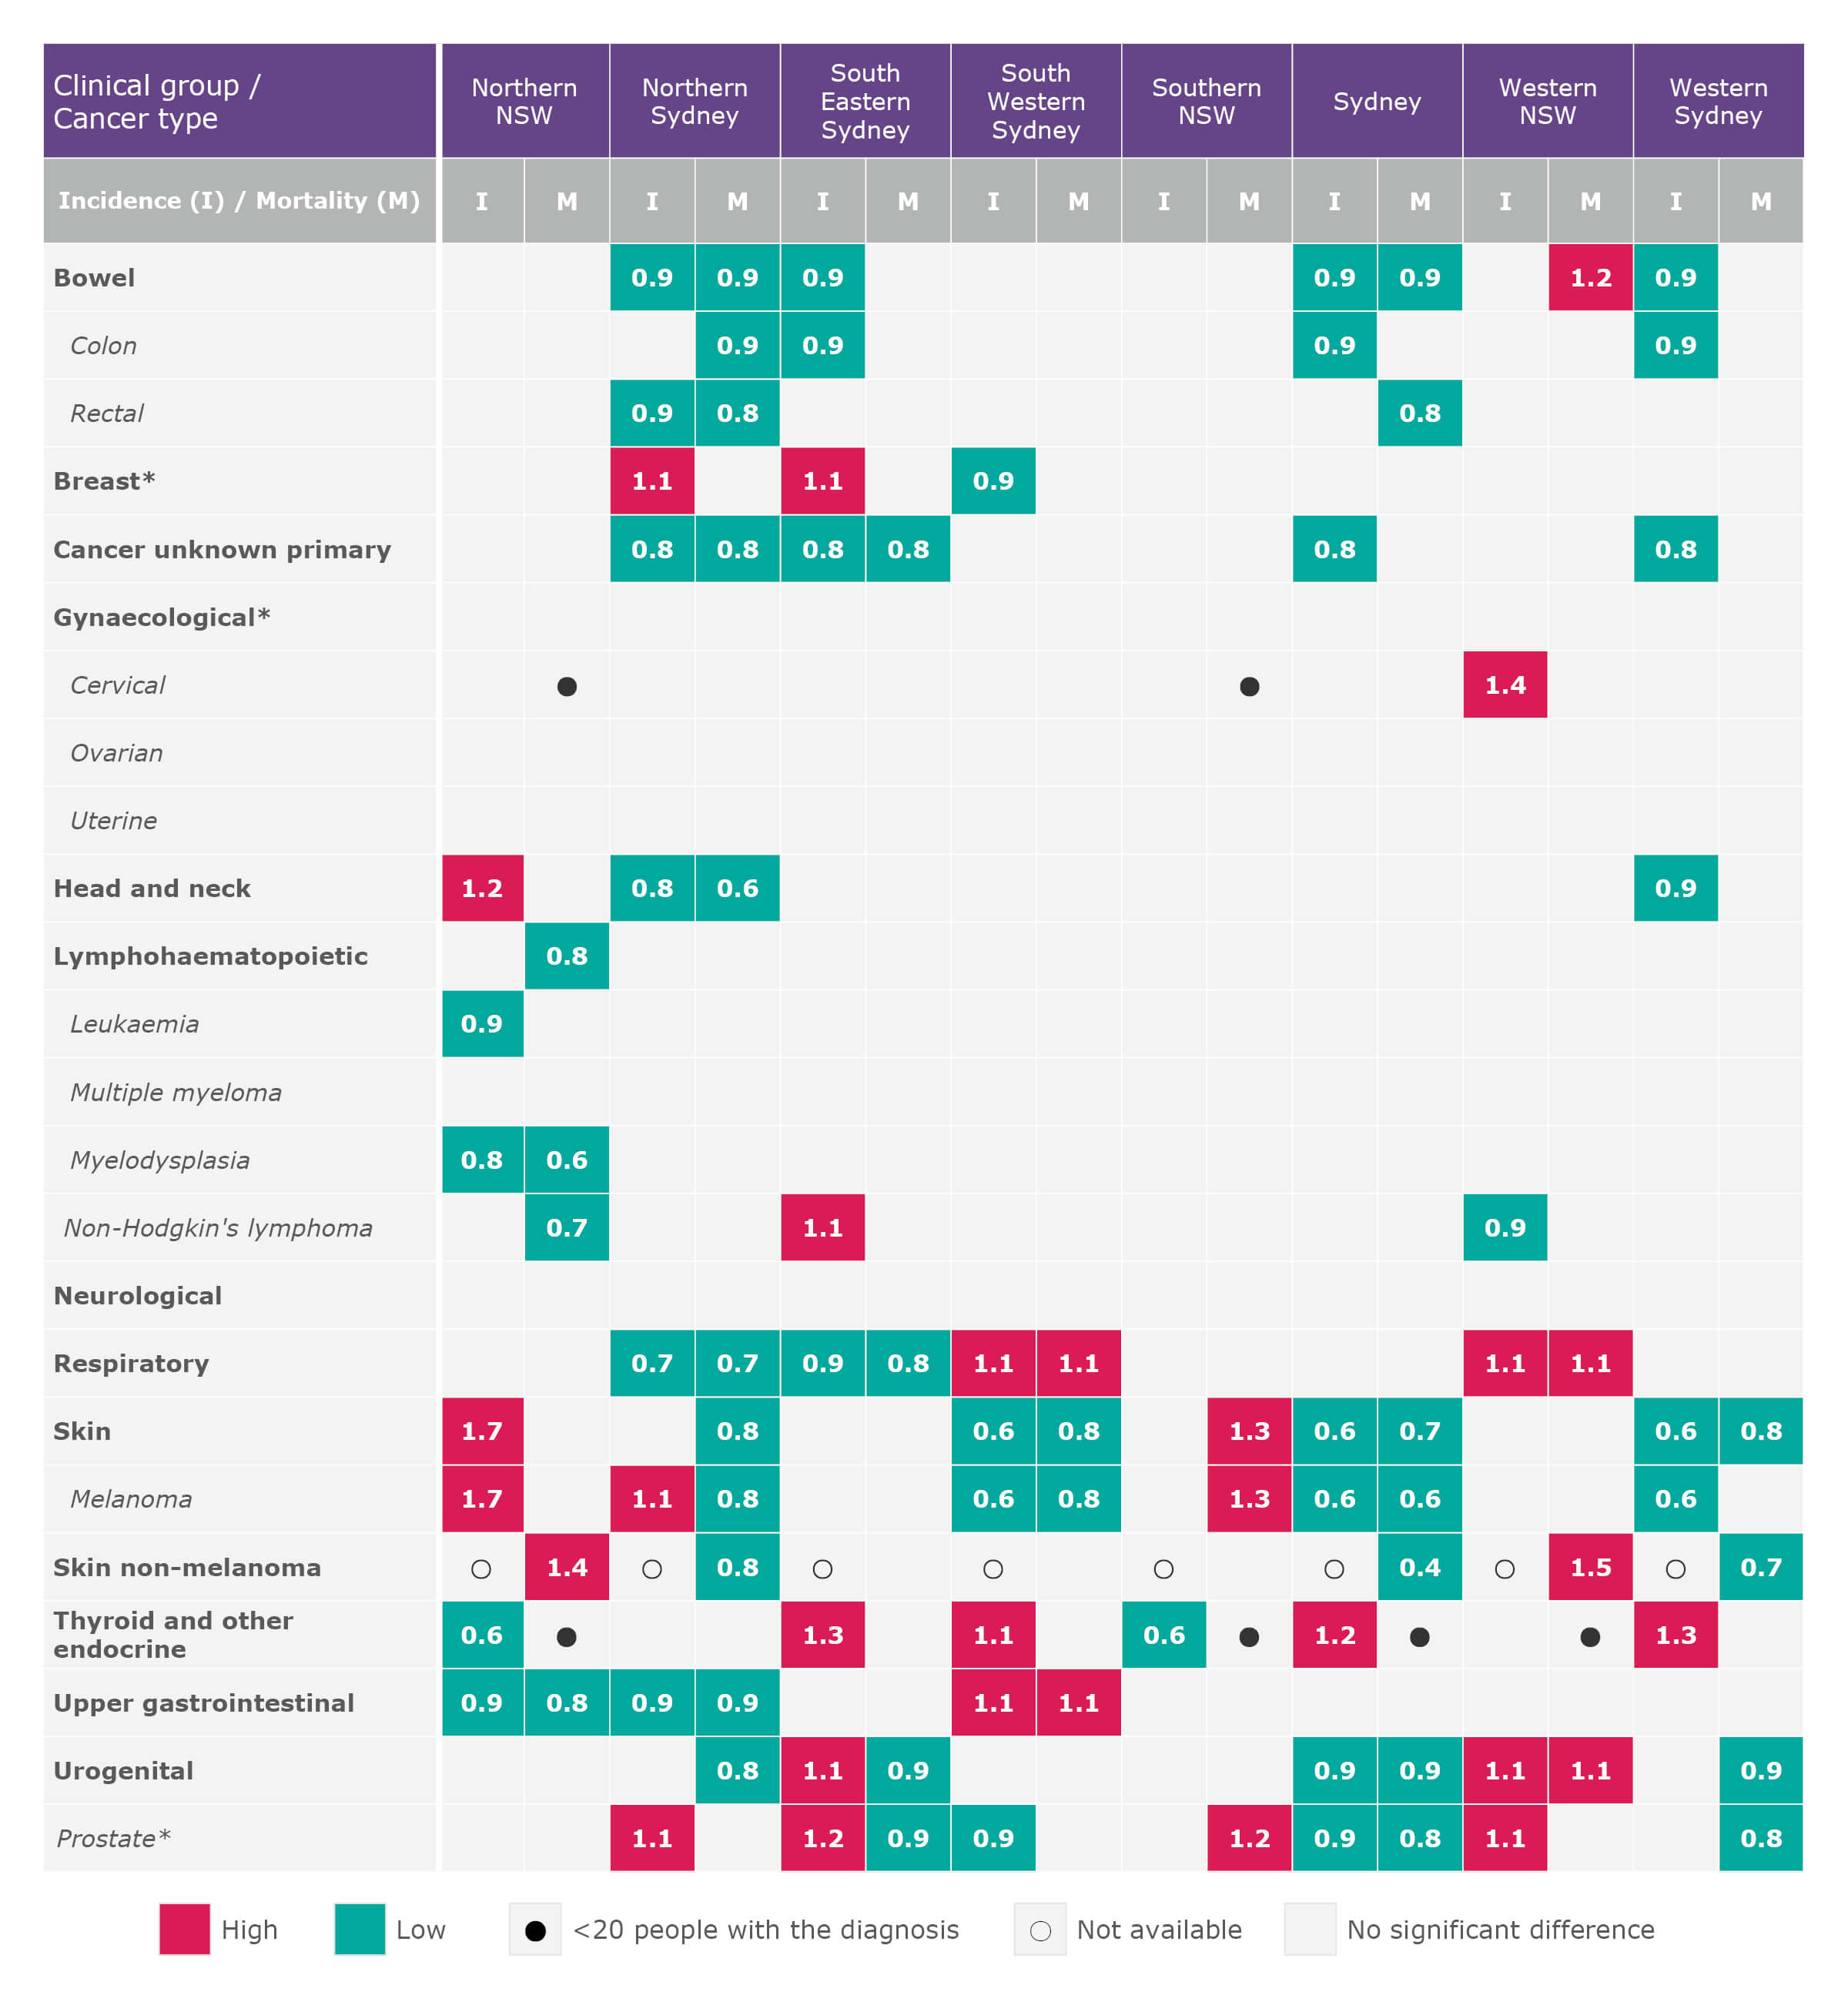
I= Standardised incidence ratio (SIR).
M= Standardised mortality ratio (SMR).
* The analyses for breast and gynaecological clinical groups were based on the female population only, while prostate analyses were based on the male population only.
Notes:
1. Data source: Institute Data Warehouse, Cancer Institute NSW (sourced from the NSW Cancer Registry (NSWCR)).
2. Data source (non-melanoma skin cancer mortality): Cause of Death Unit Record File (CODURF), Secure Analytics for Population Health Research and Intelligence (SAPHaRI), Centre for Epidemiology and Evidence, NSW Ministry of Health. CODURF is provided by the Australian Coordinating Registry for CODURF, on behalf of the Australian Registries of Births, Deaths and Marriages; Australian Coroners; and the National Coronial Information System.
3. SIR and SMR are the ratio of observed numbers to expected numbers. Refer to the 'Technical document' in the appendices for further information.
4. Clinical cancer groups of the eye, and bone and connective tissue were excluded from this analysis because these groups have lower numbers of incidence and mortality, which present an unreliable comparison at the LHD level.
5. Albury residents were included in Murrumbidgee LHD.
6. Incidence and mortality are not calculated for health networks and/or specialty networks, because they do not form geographic boundaries with resident populations. This approach applies to St Vincent’s Health Network, Sydney Children’s Hospitals Network, and Justice Health and Forensic Mental Health.
7. Incidence data are not available for non-melanoma skin cancer because it is not a notifiable cancer to the NSWCR.
8. Incidence and mortality ratios are by LHD of residence.
Why are different time periods and dates reported?
Cancer information is collected from many different sources, so it takes time to review and analyse the data. Different pieces of information may be collected over different time periods, or reported at different times. This means not all the measures reported here have the same dates.
The information presented is the most recent available for each measure at the time this report was written.
Why are confidence intervals reported here?
Confidence intervals are included when a small sample is used to represent the overall population, because there is a chance of an error due to this scaling.
In this report, a 95% confidence interval is presented only on charts where a sample of the population is used. This interval can be thought of as a margin of error.
The larger the sample size, the smaller the confidence interval range. The smaller the sample size, the larger the confidence interval range.
